
More often than not, two things are true about industrial printing companies looking to transition into inkjet printing. First, they are full of excitement to become part of the allure and promise that the digital printing industry has to offer. Second, they drastically underestimate the amount of technical knowledge it takes to have success in inkjet. How does ImageXpert know this? ImageXpert has facilitated over 200 companies taking their first baby steps into inkjet: from seeing their ink print for the first time, to learning how a printer works, to seeing how many systems need to work together to put ink onto paper.

There may be no concept more foreign to an inkjet beginner than that of the waveform. Most industrial printers are familiar with ink, and they have the tools and knowledge to manipulate its properties to be compatible with an inkjet printhead. Most industrial printers are also familiar with the substrate that they would like to print on and can design mechanisms for transporting and treating it. But how to send electricity into a printhead to get precise droplets to come out? This is new, and usually, somewhat overlooked.
A big hurdle to understanding the waveform is the lack of feedback. Usually, you can’t see how the ink moves within the printhead, which is where the waveform is in action. There are too many variables in play when inspecting the printed results, and it is nearly impossible for a beginner to differentiate effects of the waveform verses another cause. The best course of action is to analyse the drops being ejected from the printhead, before they land on the substrate. Using tools such as the JetXpert dropwatcher, you can.
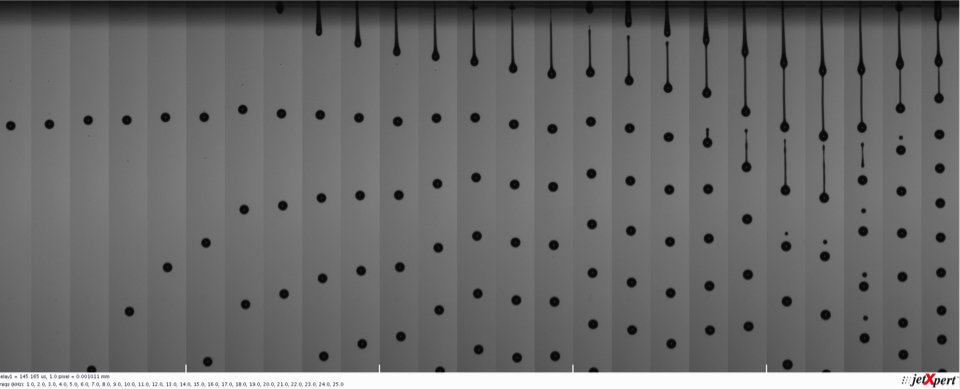
Look at the image, which depicts drops firing at a frequency ranging from 1 kHz to 25 kHz, with all other parameters kept constant. How much information can we determine about jetting with this particular waveform, just from this single image? For starters, we can determine drop volume, velocity, and trajectory. Is it constant as frequency changes? How about as the drop travels further and further from the printhead? We also see that the drop formation looks different from 18 kHz - 24 kHz than at other frequencies. The ligaments are much longer and more satellites are present. This could be a significant print quality problem if the printer is operating in that range.
There is a lot of knowledge to be gained from this single image, and best of all, it took about 30 seconds total to capture and analyse. Dropwatching systems such as these are crucial to progress in inkjet R&D. We can quickly change an aspect of the waveform and run the test again, comparing the results to look for improvements. Most of the processes are even automated. How many prints would you have to look at to learn this same information? You would need to print 25 images just to have one at each frequency, and even then, it would be difficult to determine drop volume, velocity, and trajectory from those images. As you can see, inkjet development can be very easy or very difficult, depending on the tools you have at your disposal!
ImageXpert’s presentation at the IMI Europe Inkjet Ink Development Conference in Lausanne, 15-16 March 2017, will expand on this idea by including an overview of the development tools available that make processes such as waveform optimisation more streamlined and effective. Some tools offer advanced visualisation and measurement techniques, others automate common processes to increase productivity. We will then go through a step-by-step waveform optimisation process with real images and data, providing tips and recommendations along the way. You will see what can be done to manipulate waveforms and increase drop size or speed, reduce satellites, and other common needs.
Kyle Pucci, ImageXpert Inc